
01 · SOLAR PV
Solar PV
We look after solar systems for their whole life: site survey and design, permitting and grid connection, installation and testing — then daily monitoring and preventive maintenance that keep yield high. Today we maintain and monitor hundreds of systems on commercial roofs, public buildings and schools across Israel.
01 · SIMULATOR
How much power will your roof produce?
Pick a region, system size or roof area, tilt and orientation. The estimate uses PVGIS solar data for each part of Israel.
Monthly yield
| Month | kWh |
|---|---|
| Jan | 4864.6 |
| Feb | 5238 |
| Mar | 7013.1 |
| Apr | 7667.9 |
| May | 8245 |
| Jun | 8298.4 |
| Jul | 8516.6 |
| Aug | 8274.1 |
| Sep | 7570.9 |
| Oct | 6654.2 |
| Nov | 5378.7 |
| Dec | 4767.6 |
Average day
| Hour | June | December |
|---|---|---|
| 00 | 0 | 0 |
| 01 | 0 | 0 |
| 02 | 0 | 0 |
| 03 | 0 | 0 |
| 04 | 0 | 0 |
| 05 | 0.4 | 0 |
| 06 | 3 | 1.4 |
| 07 | 8.9 | 6.8 |
| 08 | 16.4 | 14.2 |
| 09 | 23.9 | 20 |
| 10 | 30.1 | 23.6 |
| 11 | 34 | 24.3 |
| 12 | 35.5 | 22.9 |
| 13 | 34.5 | 19.3 |
| 14 | 31 | 13.6 |
| 15 | 25.4 | 6.4 |
| 16 | 18.2 | 1.2 |
| 17 | 10.5 | 0 |
| 18 | 4 | 0 |
| 19 | 0.7 | 0 |
| 20 | 0 | 0 |
| 21 | 0 | 0 |
| 22 | 0 | 0 |
| 23 | 0 | 0 |
01 · CAPABILITIES
What we do
Design & build
Electrical design, equipment selection, boards and cabling, installation and acceptance tests before energisation.
Permitting & connection
Submission and follow-through with the utility until metering and grid synchronisation.
Monitoring
Daily tracking of yield and inverter faults, with early warning on performance drops.
Maintenance
Preventive maintenance, panel cleaning, periodic electrical tests and on-site fault repair.
01 · IN DEPTH
In depth
From sun to meter: how a solar system works
Solar panels turn sunlight into direct current. The inverter converts it to alternating current at grid frequency and keeps tracking the panels’ maximum power point (MPPT), because that point moves with irradiance and temperature. From the inverter, power flows to the switchboard and on to the loads in the building. Whatever the building is not using at that moment goes out to the grid, and a bidirectional meter records the energy imported from the grid and the energy exported to it separately.
When the grid goes down, a grid-tied inverter disconnects automatically, so that it cannot energise a line that utility crews may be working on. This is anti-islanding protection. So an ordinary solar system does not supply the building during a power cut, even in full sun. Power during an outage needs storage or backup that is designed for it.
Output follows the sun: on a south-facing array it rises in the morning, peaks around solar noon and falls in the afternoon. Heat does lower the output, but only by about a third of a percent per degree of panel temperature: a typical module’s power temperature coefficient, γPmax, is about −0.33% per °C. So the claim that “after 11 AM the heat kills the voltage” is wrong: even on a hot day, the hours around noon are the day’s strongest. The simulator above shows the average June and December day for each orientation.
Sources: PVGIS data sources and calculation methods (JRC) · IEC 62446-1:2016
Orientation, tilt and shading: what really changes the yield
In Israel, south-facing panels produce more than any other orientation. The diagram shows each orientation’s yield relative to south, from the same PVGIS data the simulator uses. According to PVGIS (SARAH3 database, 14% system losses), a system tilted 30° to the south produces 1,685 kWh per kWp a year in Haifa, 1,718 in Tel Aviv, 1,771 in Be’er Sheva and 1,845 in Eilat.
On a flat roof, panels can also go in east–west rows at a 10° tilt. Each panel in such a row produces less than a south-facing one: 1,495 to 1,647 kWh per kWp a year in the same data, depending on the region and the side it faces. The gain is density: the rows hardly shade each other, so the same roof carries more kWp, and the roof as a whole can produce more. The choice is made at the design stage, based on the roof’s area and structure.
Shading matters more than it looks. The panels in a string are wired in series and carry the same current, so shade on one panel drags down the whole string, unless optimizers let each panel work at its own point. Bypass diodes inside the panel limit the loss: they route the current around the shaded section, so the panel loses only part of its output. That is why a site survey also checks water heaters, parapets, chimneys and trees. In the simulator above, you can change the orientation and tilt and watch the annual yield change.
Sources: PVGIS online tool (JRC) · IEC 62548-1:2023
How many panels in series? String length by cold open-circuit voltage
In a string, the panel voltages add up, and each panel’s open-circuit voltage (Voc, the voltage with no current flowing) rises as it gets colder. So the number of panels in series is set by the coldest morning on site, not by the working voltage on an ordinary day: on that morning the string’s open-circuit voltage must stay below the inverter’s maximum DC voltage. The cold voltage is Voc(Tmin) = Voc × [1 + β × (Tmin − 25)], and the longest string is Nmax = ⌊Vdc,max ÷ Voc(Tmin)⌋, rounded down.
An example: a 545 W panel with an open-circuit voltage of 49.75 V and a temperature coefficient β of −0.261% per °C. On a −5 °C morning, 30 degrees below standard test conditions, its open-circuit voltage rises to 53.65 V. A 1,000 V inverter can therefore take up to 18 of these panels in series, and a 1,100 V inverter up to 20. The other side is checked too: the working voltage (Vmp) on a hot day must stay above the minimum of the inverter’s MPPT range, and the current must stay within the inverter’s limits.
Israel has no official minimum design temperature, so we set it for each site. Mountain areas are colder: according to published climate records, the record lows are about −9 °C in Safed, −7 °C in Jerusalem, −1 °C in Be’er Sheva and +1 °C in Eilat. The −5 °C in the example is for illustration only; on a real project, the design temperature follows the site’s location and altitude.
Sources: IEC 62548-1:2023
01 · PROCESS
How it works
- 01
Survey & design
Site visit, roof and existing connection check, preliminary design with a capacity estimate.
- 02
Permitting
Preparing the file and submitting to the utility and relevant authorities.
- 03
Build & test
Installation by our own crew, with full electrical tests before energisation.
- 04
Commissioning & handover
Connection, start-up and an orderly handover with system documentation.
- 05
Monitoring & O&M
Daily monitoring and preventive maintenance for the life of the system.
01 · CLIENTS
Who it is for
- Commercial and industrial roofs
- Public buildings and schools
- Local authorities
- Agriculture and property owners
01 · PROJECTS
Projects in this area
01 · SOLAR PV · 2026
Solar O&M portfolio
Preventive maintenance, cleaning and daily monitoring of systems on commercial roofs, public and industrial buildings, for nine institutional clients.
- Systems
- 194
- Capacity
- 31.8 MW
Nationwide
01 · SOLAR PV · 2024
Public-building maintenance cluster
Coordination and maintenance of solar systems on public buildings and institutions in dozens of towns in the South and Centre.
- Systems
- 215
- Capacity
- 16.9 MW
- Towns
- 36
South and Centre
01 · SOLAR PV · 2022
Solar rooftops for public buildings
Solar systems built on the buildings of a national public body, from design to grid connection.
- Systems
- 20
- Capacity
- 3.5 MW
Ashkelon, Be’er Sheva, Jerusalem, Tel Aviv and more
01 · FIELD
From the field
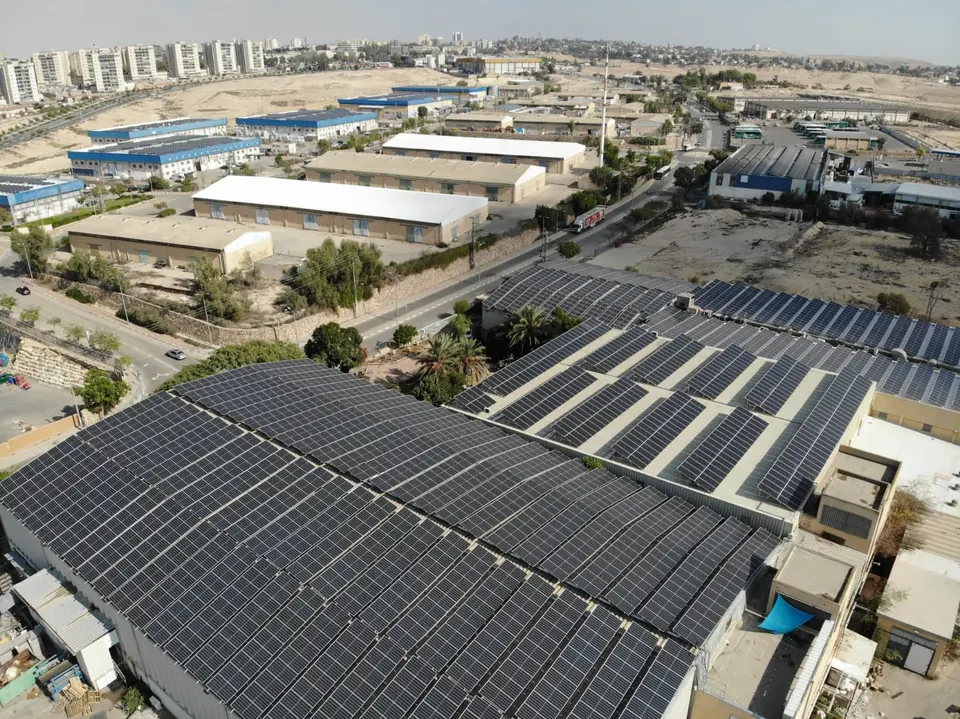
Industrial zone: large building roofs covered with solar systems, drone photo 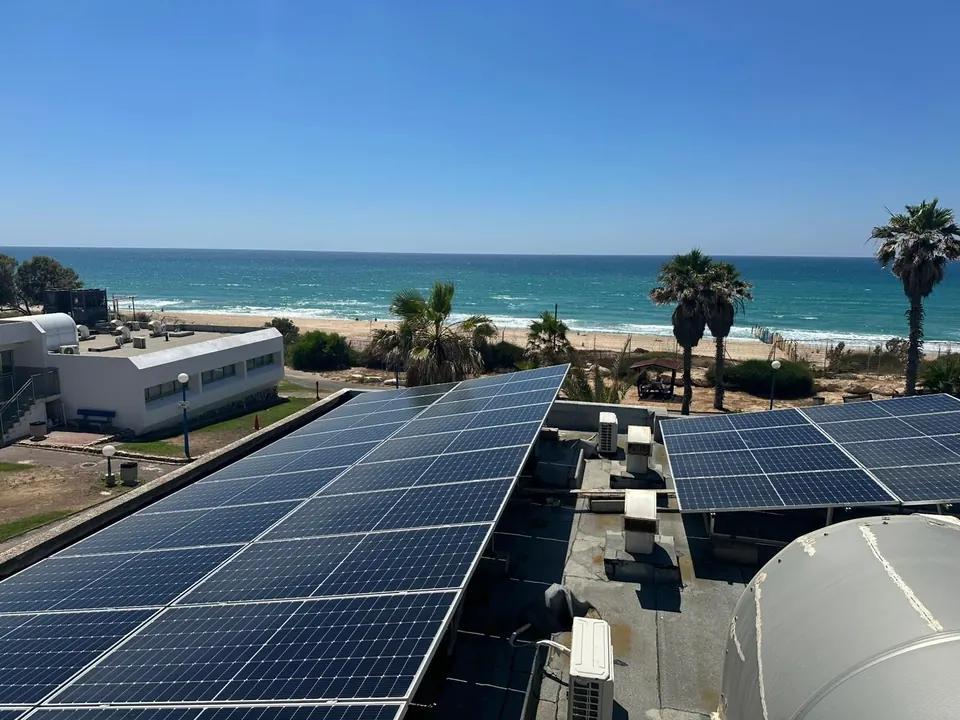
Rooftop solar system facing the sea 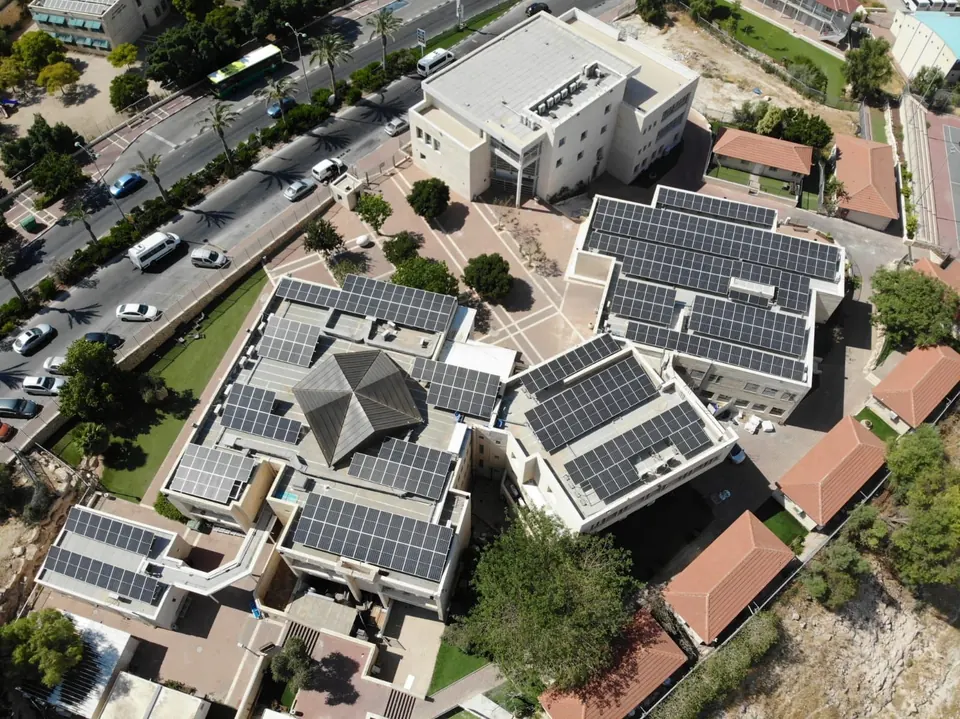
A school campus in Ma’ale Adumim: solar systems on its roofs, drone photo 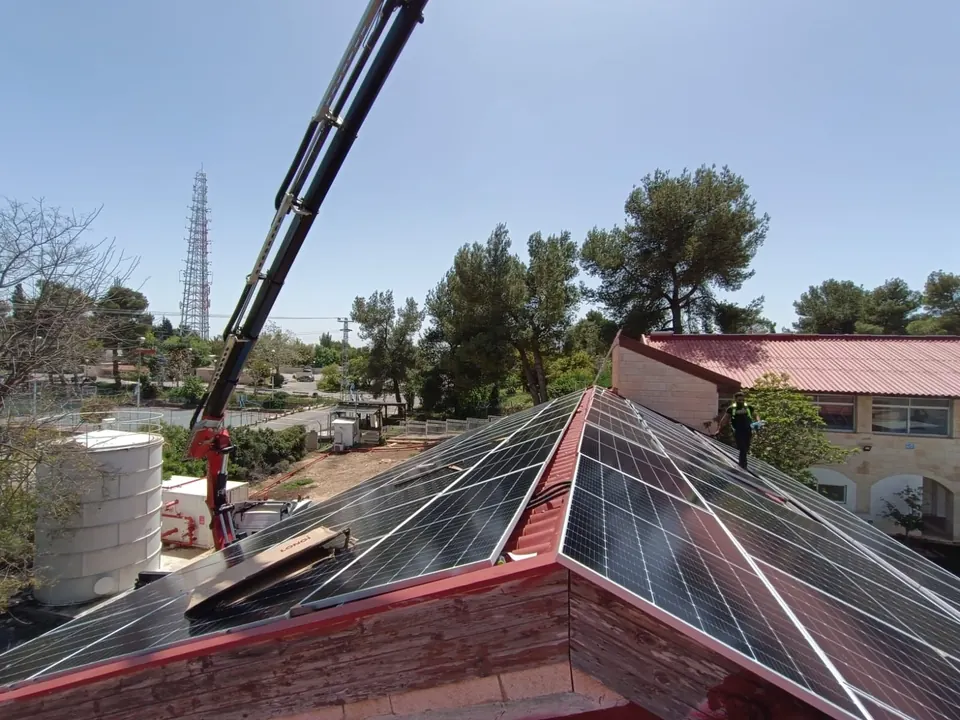
Installing panels on a tiled roof with a crane 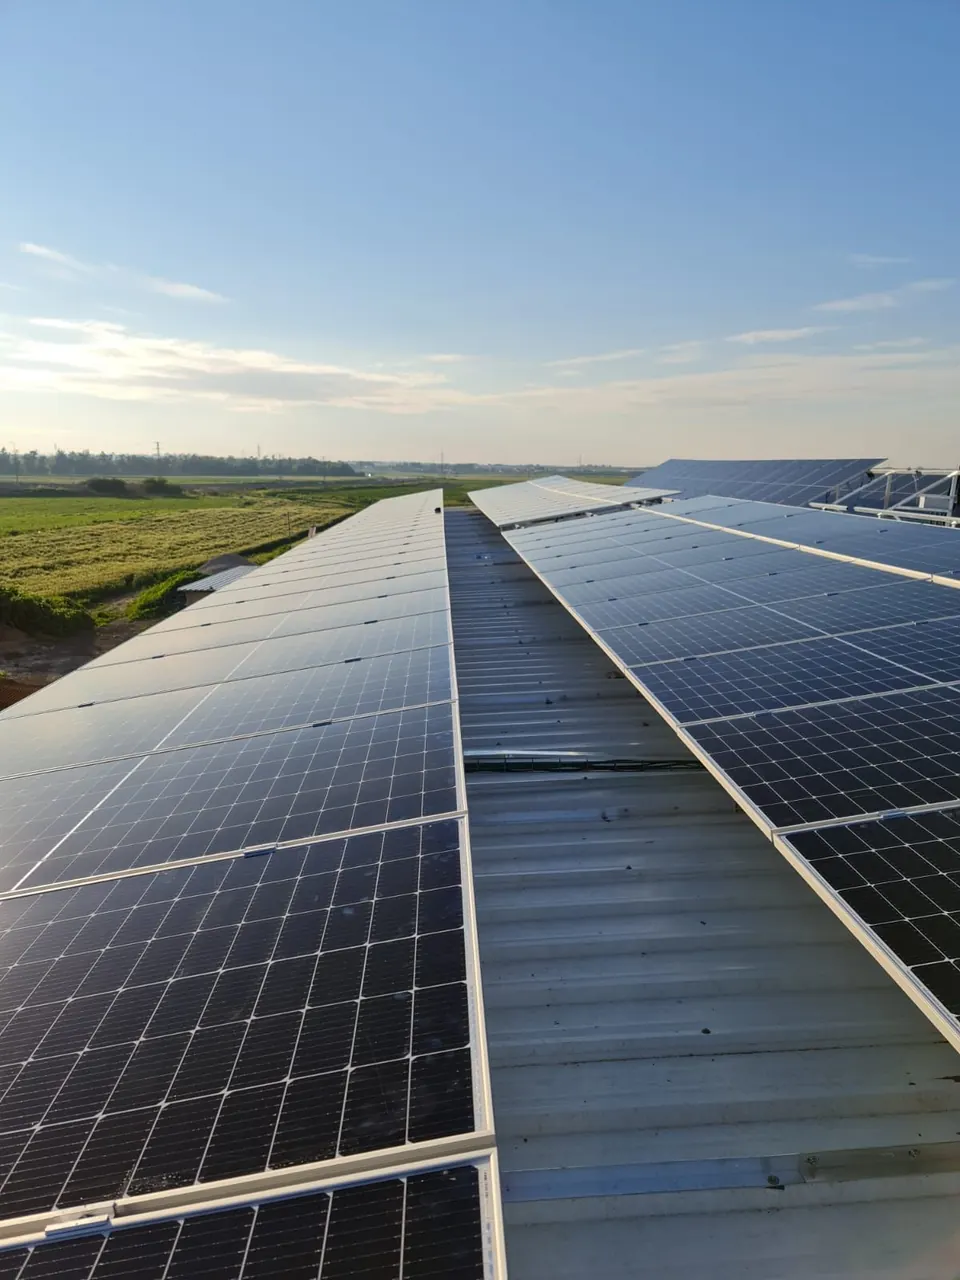
Rows of panels on a metal roof at sunrise 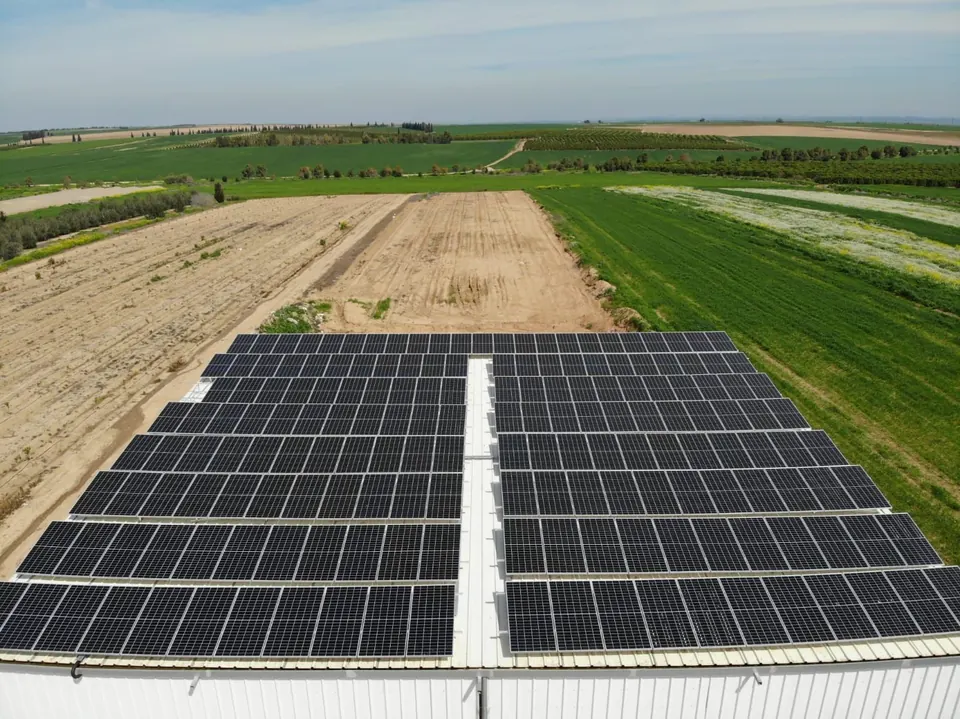
Farm building with a solar system among green fields, drone photo 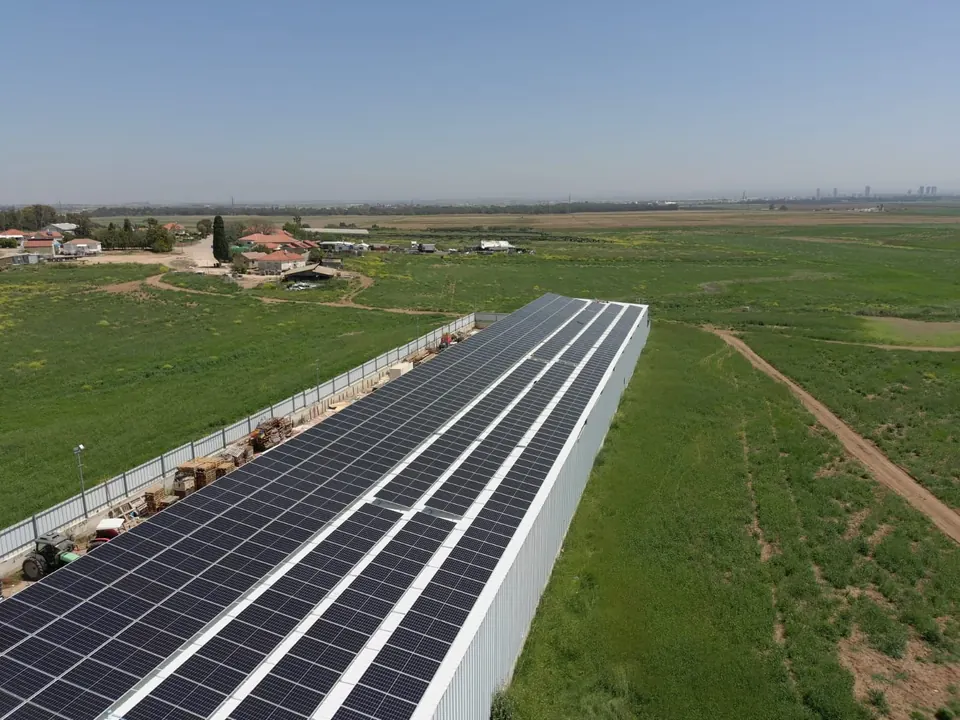
Long farm building with solar panels along its full length, drone photo 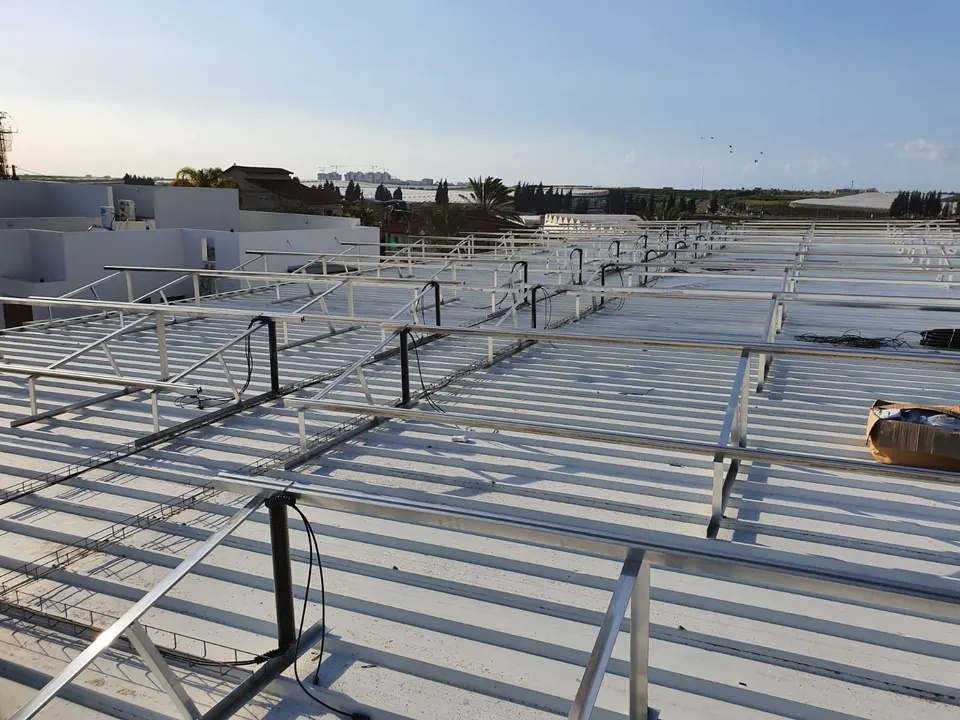
Structure stage: rails, optimizers and cable trays before the panels go on
01 · FAQ
Frequently asked questions
How long does a solar installation take?
Work on site takes days to weeks, depending on the size of the system and the roof. Most of the project time goes to the stages around the installation: design, a structural check of the roof, approvals, and coordinating the grid connection with the utility. The exact schedule can only be set after a site survey.
Is my roof suitable?
We look at orientation and tilt, shading from water heaters, parapets and nearby buildings, the roof’s capacity to carry the weight, the roof type and the free area. As a rule of thumb, a flat roof needs 5.5 to 9.5 m² of usable area per kWp, depending on the tilt of the rows, and a pitched roof about 5 m² per kWp. In the simulator above you can enter a roof area and get an estimate of the system size and the annual yield.
What happens to the system in a power cut?
A grid-tied inverter disconnects automatically when the grid fails, so that it cannot energise a line that utility crews may be working on. So an ordinary solar system does not supply the building during an outage, even on a sunny day. Power during an outage needs storage or backup designed for it, with an inverter that supports backup operation.
How do you keep the yield up over the years?
Ongoing monitoring catches a drop in yield or an inverter that has stopped. Cleaning pays when the yield lost to dirt is worth more than the cleaning. A periodic inspection checks connections, protection and insulation, and uses thermography and IV curves as described in IEC 62446. Even healthy panels lose a little output over the years: the median degradation is 0.5–0.75% a year.
CONTACT
Want to hear more?
Leave your details and we will come back with a proposal that fits your site.